Tag: analytics

Do You Know About Heat Maps?

Imagine being able to determine exactly what your users are clicking on for any page on your website? It is entirely possible with the use of heat maps. Heat map software is a type of web analytics that tracks movements and clicks of your users. They really give you the ability to home in on what kinds of actions users are taking on your website.

The downside to using heat maps is that they cost money, at least the worthwhile ones do. You will have to weigh the benefits against the potential costs. The good news is that companies that provide this type of software will give you a 30-day free trial. It is worth it to take them up on this offer.

Heat maps work by adding a small segment of JavaScript code on your website. Just as with other web analytics software, this has the disadvantage of not working when users disable their browsers. But that shouldn’t be too much of a road block because you want to look at these metrics in the aggregate. Most people do not block JavaScript so you will get a good sampling of data to work with.

Heat maps typically are used to determine such actions as how users are filling out forms. They can also tell you when users are trying to click on components of your page that you haven’t made clickable. This happens often with images. You’d be surprised at how many people click on images. Knowing this information, you could easily make all your images clickable and bring them to a landing page or sales page.

The major vendors in the heat map space are CrazyEgg.com, Tealeaf.com, and Sumome.com. There may be others that pop up as this type of analysis takes hold. There are some free solutions available but they don’t offer all the bells and whistles as the paid options.

Some vendors will provide what is known as scroll maps as another feature. What this tells you is which areas of your pages are users spending the most time in. This can help you place the call to actions is the most heavily used areas. It can also give insight as to whether they are even scrolling down in the first place. If they are not, this could be an indication that the information provided in the fold is not strong enough to keep them on you page or website.

Categories: SEO Keywords Tags: Tags:

Web Analytics as a Business

If you finally get around to installing and using web analytics software, you will discover how much data they capture on the behalf of your website. You may think this is great. But most webmasters have no clue as to how to decipher these metrics. That spells huge opportunities for people willing to take the plunge and get through the learning curve.

Google makes training available for its version of web analytics, named appropriately enough, Google Analytics (GA). Even if you aren’t using GA for your own website, the training is extensive enough to learn what you need to know regarding web analytics. Tools may call metrics different names among vendors. They also may have different ways of capturing and reporting the metrics, but similarities between the products will exist throughout. After you go through Google’s training, other vendors software packages will be a breeze to learn. You just have to figure out the differences.

There will be plenty of webmasters that don’t want to deal with the intricacies involved with web analytics packages. Websites that are starting to gain traction in the search engines should be easy prospects as they won’t want to lose that positive growth. It is a matter of reaching out to these website owners and presenting yourself as an expert on web analytics. You can customize reports for these clients and charge them monthly maintenance or monitoring fees.

Using your web analytics expertise can also be a way in to offer other services like SEO or as a Social Media Expert. Another possibility is to offer video creation services or any content generation for that matter. To keep your time free consider outsourcing much of this work. You could even tie everything together by offering to become the Content Marketing Strategist for these companies. Simply put together a content strategy for the particular business and set up monthly payments based on services the clients agree to pay for. You can offer a discount if they client takes on all of the services you offer.

Basing a business off of web analytics is quite feasible because it is an activity that has the potential to improve the visibility of clients websites. This could lead to an increase in sales and customers. You help keep the business owner from having to learn complicated software. They can continue performing the core tasks which is the reason why they started the business in the first place.

Categories: SEO Keywords Tags: Tags:

Use Tagging With Your Web Analytics for Better Tracking

Part of the appeal of using web analytics is to be able to determine what is working and tweak what is not. But if you are not able to track everything that drives traffic to your sight, you may be shooting in the dark, with respect to your analysis. Take Pay Per Click (PPC), for instance. Your web analytics will only show that the page was visited, not that it came from your PPC campaigns.

While you can set up some amount of tracking using what is known as actions in your PPC network (and you should), it still won’t show up in your analytics as coming from your PPC. Your analytics will tell you the page that was visited. But suppose you want to use that page across various PPC networks and Facebook advertising? How will you know which one is driving the most traffic and converting?

One way is to set up separate landing pages for each of the PPC networks. If you don’t have many campaigns this may work okay. However, as your campaigns grow you are going to have three or four different landing pages per campaign, or however many networks you use. This can get quite cumbersome over time.

A better way is to tag the URL. Assume your website is called xyz.com and you set up a landing page. Suppose you set up a campaign called sales in your Google Adwords account.

You could tag the URL as follows:
http://xyz.com/landing-page/?Adwords-Sales

When visitors click on this link via Adwords, this tag will appear in your web analytics reports. If you are using Bing PPC you could use the following:
http://xyz.com/landing-page/?Bing-Sales

You can label your tags whatever you want. One caveat is if the URL you want to track already has a tag in it, this method may not work. You have to check the URL before you add it to your PPC campaigns, or anywhere else you want to use this technique. If you see that the correct page does not come up, or you get what is known as a 404 not found error, then you will have to find another way to track.

Categories: SEO Keywords Tags: Tags:

The Top Web Analytics Metrics to Track Part 1

Most web analytics programs track hundreds of variables. To come up with a predefined list of metrics that are the same for all webmasters equally would be a daunting undertaking, if not impossible. What works for your website may not work for others. You may not get a lot of traffic to your website but the people that visit tend to buy from you. But there are a few metrics that most webmasters feel the need to track. They are also the metrics that tend to be common across most web analytic software packages.

Bounce Rate
Bounce rate is the number of single page visits divided by the total number of entrances to that page. Typically, a high bounce rate indicates that visitors were not interested in what the page had to offer or convey. However, this is not always the case. Suppose you gave your readers exactly what they were searching for and the page answered the question they had. They no longer need an answer so they leave your page. In other words, you gave them too much information. If you instead, gave them some of the information and then you asked them to subscribe to your newsletter in order to get the rest, this will not only help your bounce rate but it will build your list as well.

Exit Rate
This is the last page that a user visited on your website. It’s the place where the user decided that your website is no longer relevant to what they are seeking. If you see a page with a high exit rate, you may want to try and determine what it is about the page that is making visitors leave. Perhaps there is no call to action. It could even be something as simple as grammar errors. Paragraphs that are too long and wordy can also generate high exit rates.

Average Time Spent on Page
If Google sees that you have pages that people are spending a lot of time on, they are going to reward you with higher rankings, all things being equal. If this number is high, you are likely doing something right with respect to the content you are presenting. Try to determine what it is about the page that is keeping people on it and do more of the same.
As stated in the first paragraph, there are many other metrics that you can track and what I believe are the top three may be quite different than what others believe should be the top three. Over time, you will develop your own priority on which metrics to track.

Categories: SEO Keywords Tags: Tags:

How to Determine Your Budget for Marketing Automation

How to Determine Your Budget for Marketing Automation

Determining a budget for a new segment of your business can be tough, if not almost impossible. There are many unknowns when stepping into areas or processes in which you have no direct experience, and this can lead to a feeling of bewilderment. The first step in creating any budget is to outline your goals and objectives. Why do you want to automate your marketing? Are you even in a place where marketing automation makes sense for your business? How soon will you be ready to begin? When would you like the process completely in place (be realistic)? Do you have sufficient staff currently to handle the process, or will you have to hire and train additional staff? These and other questions must be answered prior to creating an automation budget.

The important thing, when setting up a budget, is to avoid the tendency to overspend. On the other hand, you should not cut corners and spend too little  you have to get a feel for what is the appropriate initial investment, as well as ongoing, monthly and annual, expenses.

Your initial investment into marketing automation may or may not include the services of a consultant. If you decide to consult with a professional, they may draw up a budget for you based on your objectives. However, if you decide not to enlist a consultant, you’ll have to determine your budget on your own. Major components of a marketing automation budget may be software licenses, training for existing staff, and additional staff and training, among other things.

If you find that you don’t have quite the budget necessary to implement marketing automation, there are ways to still get closer to full automation without actually spending the big money that most full marketing automation solutions require.

Marketing automation falls roughly into three categories: Sales Force Automation, Drip Marketing Automation, and Content Marketing Automation. For each of these categories, there are several free and inexpensive solutions, aimed at the smaller business owner.

Even if you opt to go the free/inexpensive route, you will surely need to hire one or more individuals to implement and maintain this new department. Even though you already have a Marketing Department, marketing automation is a separate function (arguably within Marketing, yes) that should not be lumped together with Marketing. Each area has subtle, but distinct, differences in their objectives and operations.

The need for a comprehensive and detailed budget is crucial, especially if you decide to take the free or inexpensive route. When your overall business financial picture is relatively small, errors in projection or budgeting can be devastating.

Categories: Marketing Tags: Tags:

Referrer Spam Can Skew Web Analytics Data

You log into your web analytics dashboard. You get excited because you see a surge of traffic. It is from several different sites. Finally, all your content marketing efforts are starting to pay off. Then you discover that your bounce rate is 100% and the average time spent is 0 seconds. This doesn’t seem right. How can all of these visitors not like the content and leave before even reading it? This is a classic sign of referrer spam and it can skew your metrics in a big way.

Referrer spam is traffic from automated bots that inflate the number of hits in your web analytics metrics. This will invoke the curiosity in unsuspecting webmasters who will go to the site that appears in the analytics report. They do this across many websites and as webmasters explore these sites, it makes it seem to Google that the sites are getting traffic from different sources, i.e., the webmasters themselves. The belief is that Google will consider this traffic legitimate and possibly increase the rank of the site.

The increase in your hits count, is not the only metric to be affected by this practice. As mentioned before, your bounce rate will be at 100% and your average time spent will be 0 seconds. Google does not look highly on sites with high bounce rates. If your visitors are not sticking around to read what you have written this is also not a good situation. Hopefully, the Google algorithm keeps itself apprised of these spam sites and adjusts accordingly.

There are several ways to block this referral spam. However, this means you will have an added duty of frequently checking for new spam sites. It also means for some of the solutions to tinker with a file known as the .htaccess. This is a file that contains rules that can be defined to allow or block certain web entities, including websites. Many webmasters are not familiar with this file and would not be comfortable making any changes. In such cases, it’s best to contact your web hosting company’s technical support for guidance or they can make the changes for you.

Another option is to ignore the situation altogether. If you hold the belief that Google will be smart enough to figure out which traffic data comes from spam bots, this would clearly be the best option for you. Although, you will have to remember to back out this skewed data when you are trying to adjust your content strategy based on your web analytics data.

Categories: SEO Keywords Tags: Tags:

Log File Analysis vs. Web Analytics

Before web analytics came to the scene, webmasters relied on log files. These files are stored on your web hosting account. Log files still have some usefulness, although there are shortfalls when using them. Web analytics use a concept known as page tagging. This requires a snippet of JavaScript to be placed on your website somewhere. It analyzes the HTML markup and records such items as what pages users have visited, when they visited, and where they come from, among many other metrics. A cookie is also tracked to determine if the user has been to your website before. Page tagging has its shortfalls as well, some of which will be explored here.

Log file analysis doesn’t require JavaScript to be placed on your website so it is available as soon as you create your website. When visitors or search engine bots visit your website, this gets recorded in the log file. Although log files are not as widely used today, they can be used as a way to check the validity of page tagging or web analytics data. One major limitation is that your hosting provider may periodically flush the log file. If this happens, you won’t be able to maintain a historical perspective for your website. If the hosting company does not empty the file, it can get quite big over time. If you have too many files and the sizes of those files get large, your hosting company may cry foul that you are violating fair use.

You may be thinking that you need to decipher this log file yourself. The good news is that most of the major hosting companies provide tools right within your account to interpret these log files. Usually, you can run them directly from your dashboard. You should see an icon called Webalizer or Awstats. If these don’t exist, contact your hosting company to find out if there any alternative programs.

Page tagging via web analytics stores the data at the provider’s website. The advantage here is that you won’t be using up resources on your website. You will need to include a piece of code that the provider gives you. As mentioned before, this is usually JavaScript code. Page tagging provides much more data and that data is more comprehensive than what is provided by log files. The biggest limitation with page tagging is if the user has disabled JavaScript on their browser or has an add in that does so, you will not get any data for that user. This is why using both page tagging and log file analysis can be a good check.

Categories: SEO Keywords Tags: Tags:

Pinterest Analytics

pinterestanalytics

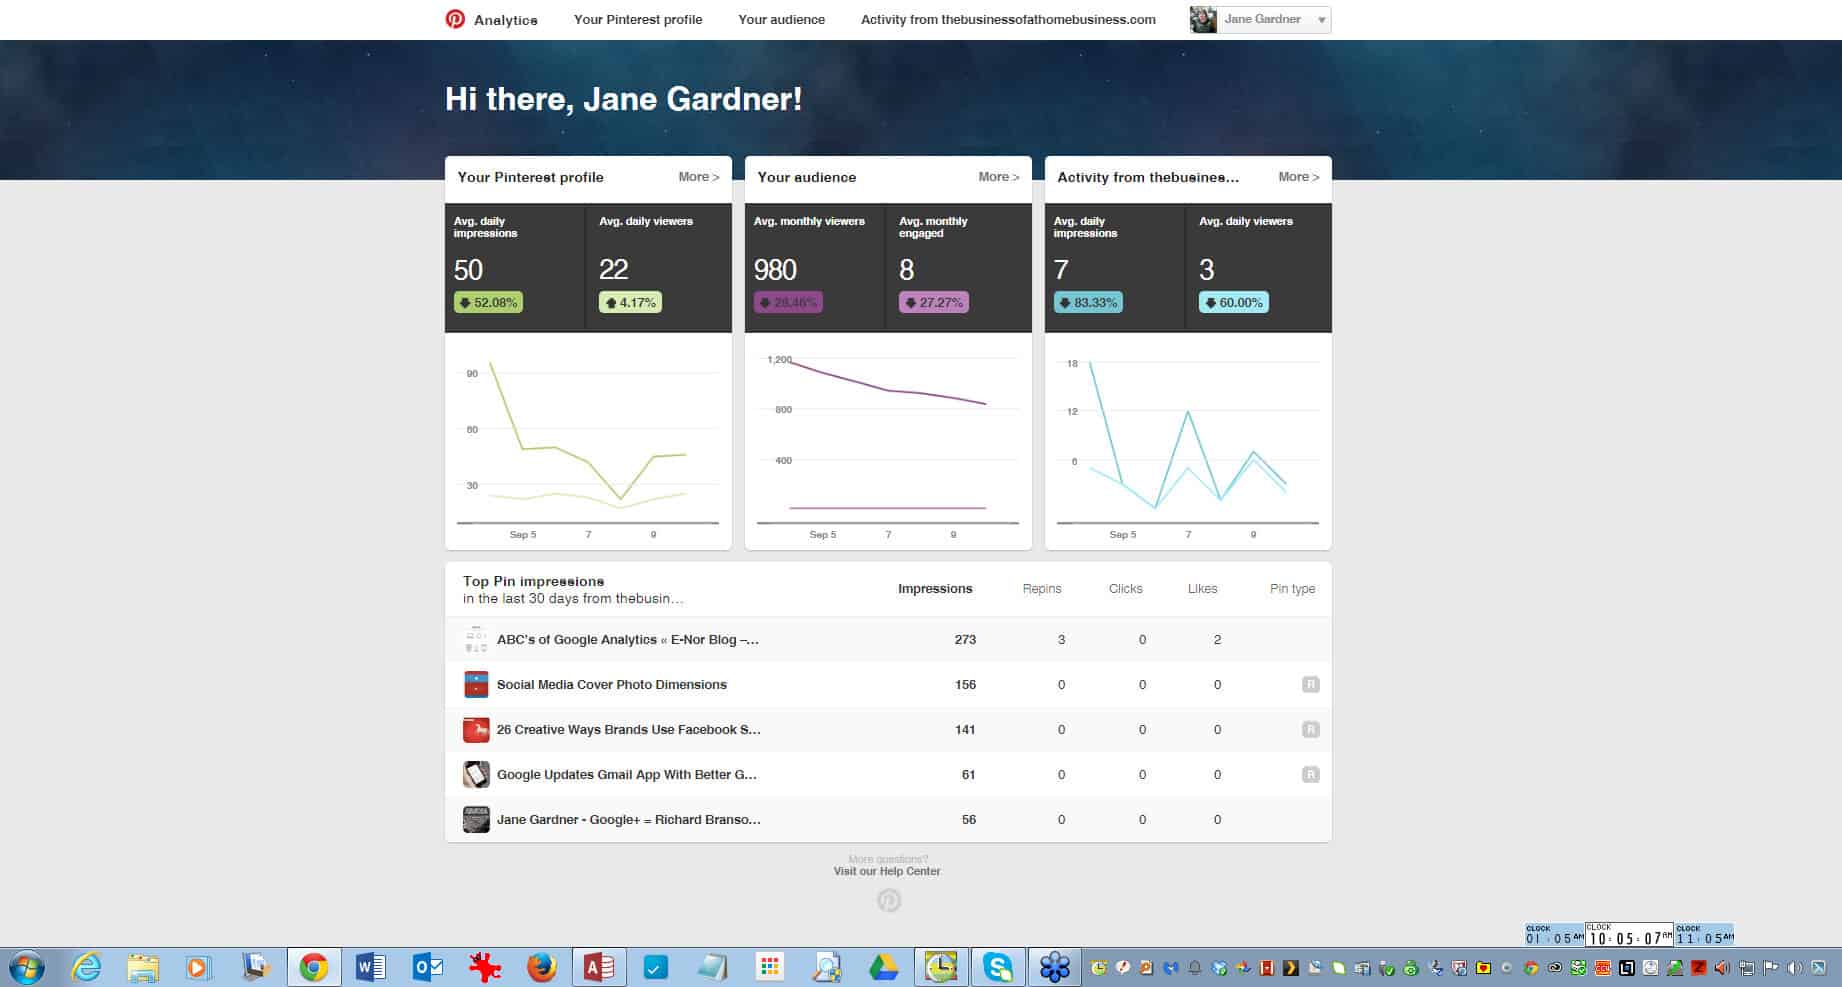
Have you checked your Pinterest analytics?  Did you know that Pinterest had measurements and analytics that you can use in your marketing strategy?  This is a screenshare of my Pinterest Business Analytics from September 2014. 

According to Pinterest here are some of the marketing information you can get from your Analytics. 

Profile analytics show you how Pins from your profile are doing.

Filter by device: You can use the dropdown menu to filter profile data by device. Learn what people are seeing, clicking and Pinning from a particular device (like their phone), or from all devices combined.

Impressions

The number of times a Pin from your profile has appeared on any feed. You’ll see it first as a daily average, but you can use the graph to look at specific dates. Use the date picker to see data across different time periods.


You’ll also see the top 50 Pins with the most impressions, and the boards with top Pin impressions, for the past 30 days.

Tip: You can use this data to see which of your Pins are getting the most reach across Pinterest, decide what Pins will appeal to your audience, and add more Pins to your profile to increase impressions.

Repins

The number of times someone added your Pin to one of their own boards. Repins are how Pins get shared across Pinterest. You’ll see it first as a daily average, but you can use the graph to look at specific dates. Use the date picker to see data across different time periods.

Note: We started collecting profile repin data Feb. 1, 2014. Your data will go back to that date.

You’ll also see the most repinned Pins from the last 30 days and the boards with the most repinned Pins from the last 30 days.

Tip: These popular Pins on Pinterest can help you think about what content to create in the future.

Clicks

The number of clicks and unique visits back to your website. You’ll see it first as a daily average, but you can use the graph to look at specific dates. Use the date picker to see data across different time periods.

Note: We started collecting profile click data Feb. 1, 2014. Your data will go back to that date.

You’ll also see the 50 Pins with the most clicks, and which of your boards have Pins with the most clicks, for the past 30 days.

Tip: These Pins help you drive traffic to your website. You can use this information to think about how you might organize your products and other content on your website.

All-time Metrics

An assortment of metrics, including:

  • Your all-time most repinned Pins: This goes back to the beginning of your Pinterest account.

  • Best in search: Pins that are ranked highly in search. You can improve the search quality rankings of your Pins by writing quality descriptions, using Rich Pins and making sure all of your Pins link back to somewhere meaningful.

  • Power Pins: Pins with all-time high engagement from Pinners, using a combination of likes, repins, comments, sends and more. This goes back to the beginning of your Pinterest account.